

Appearance
XYZ Chart
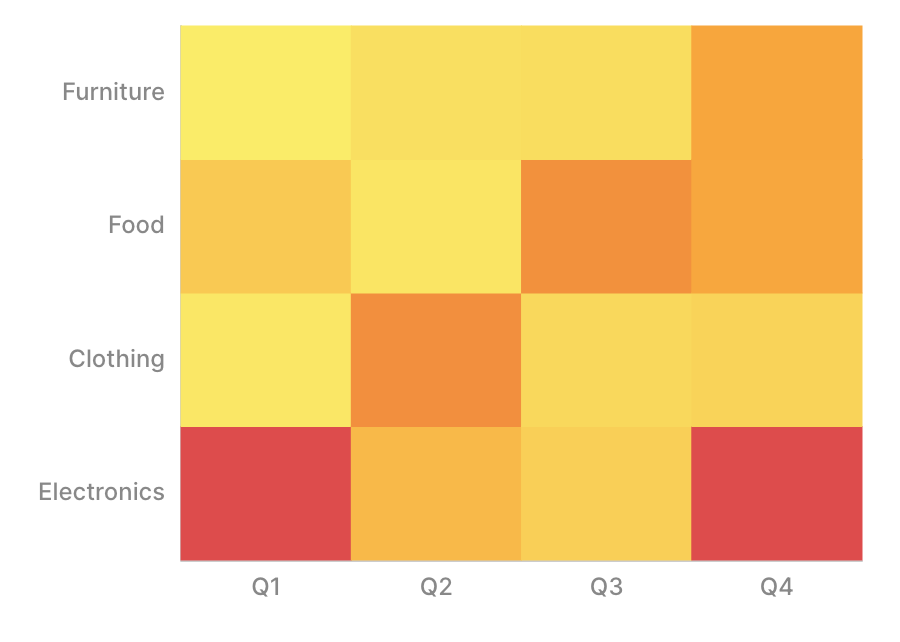
XYZ Chart aggregates a Z value (metric) against combinations of X value and Y value (both dimensions) and displays the result. The difference from XY Chart is that the Y side is also a dimension.
Drawing types
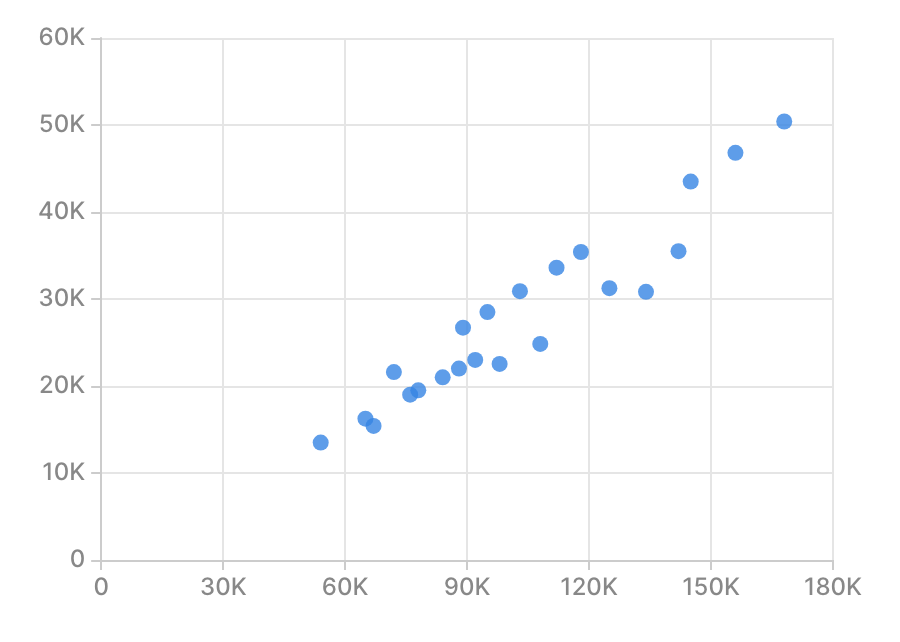
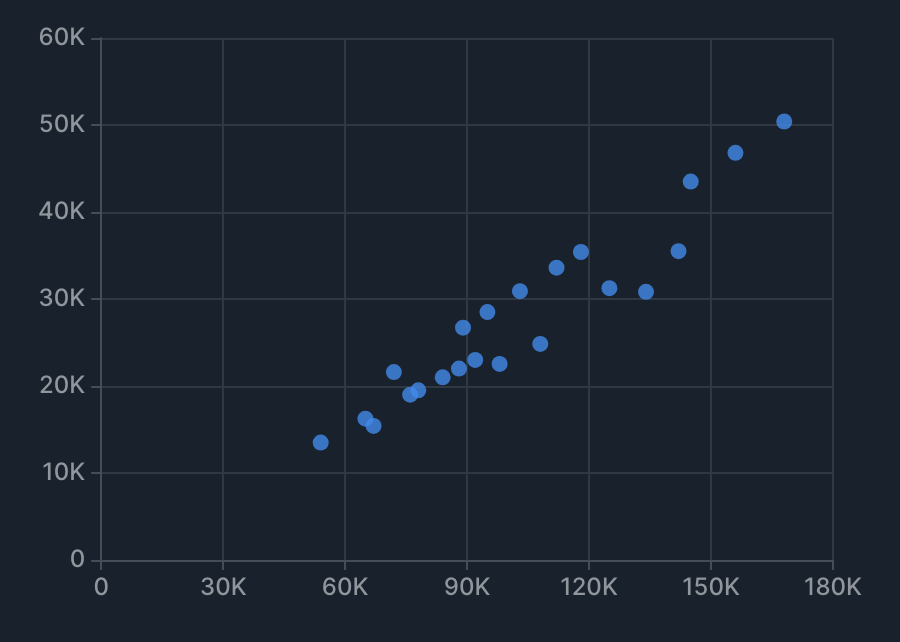
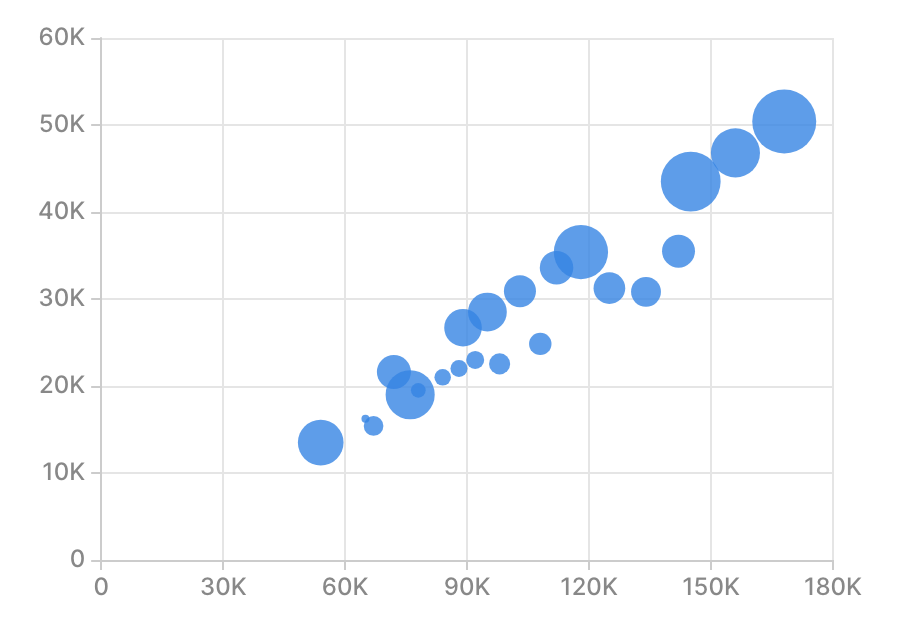
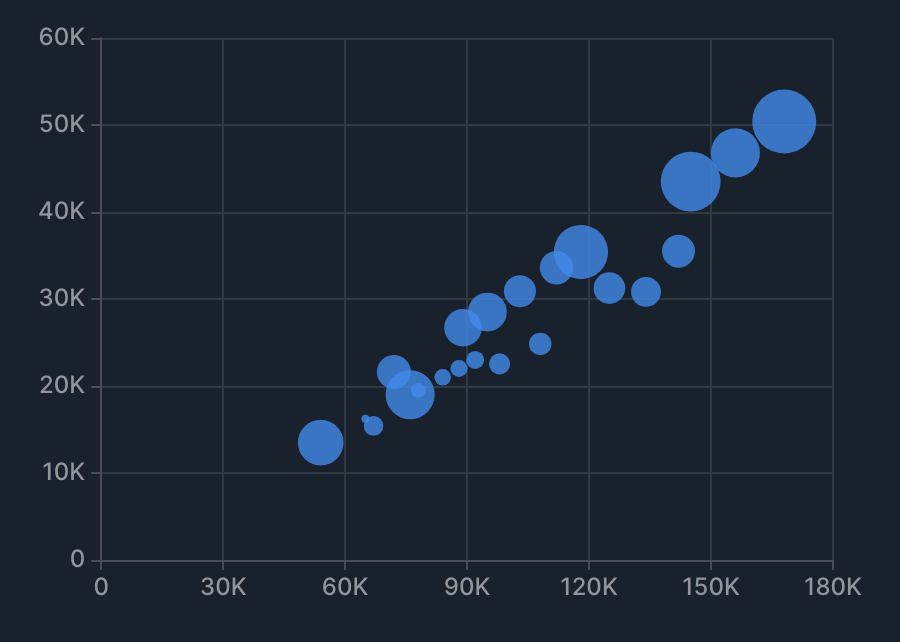
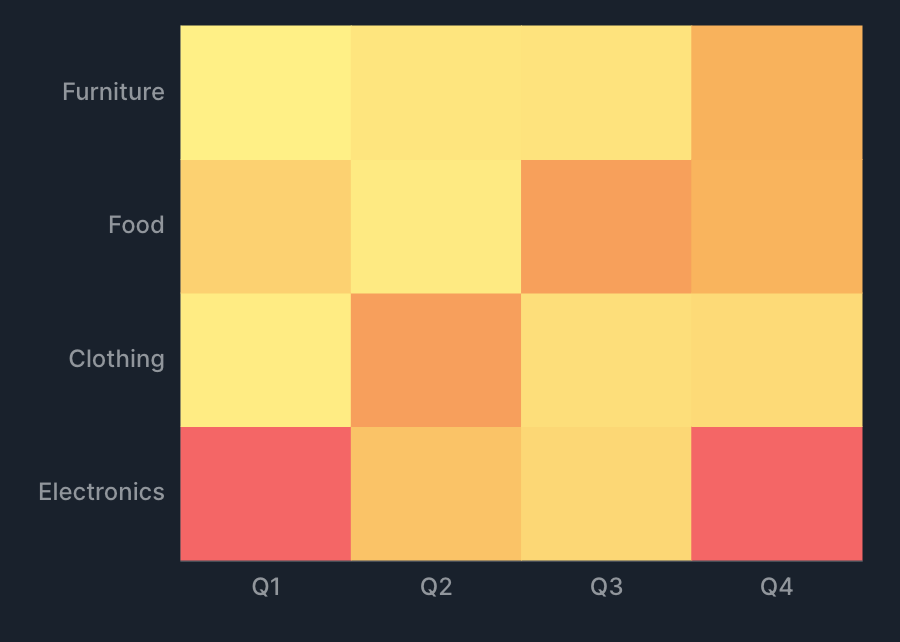
XYZ Chart supports the following drawing types.
Specification
Aggregation
XYZ Chart treats X value and Y value as dimensions and Z value as a metric, aggregating Z for each combination of X and Y. See Dimensions and metrics for the concepts behind dimensions and metrics.
| Item | Role | Notes |
|---|---|---|
| X value | Dimension | Becomes the X axis. |
| Y value | Dimension | Becomes the Y axis. |
| Z value | Metric | Specified for bubble and heatmap. |
| Group by | Dimension | Scatter and bubble only (splits the series). |
Examples
- Show "total sales by product category × region" as a heatmap.
- X value: product category.
- Y value: region.
- Z value: sum of sales.
- Show "the relationship between ad spend and sales" as a bubble chart.
- X value: ad spend.
- Y value: sales.
- Z value: profit.
X-axis specification
In XYZ Chart, how the X and Y axes are treated depends on the drawing type.
- For heatmap, both the X and Y axes are category axes.
- For scatter and bubble, the X axis is a category, time, or numeric axis depending on the data type, and the Y axis is a numeric axis.
For the behavior of each axis (display rules for category, time, and numeric axes), see X-axis specification for XY Chart.
Tips
Frame
XYZ Chart supports the frame feature. See Frame for details.
Reference lines, trends, and statistics
See Reference lines, trends, and statistics for details.