

Appearance
Graph Chart
Graph Chart visualizes relationships or transitions between items. It aggregates a weight (metric) for each combination of source and target (dimensions).
Drawing types
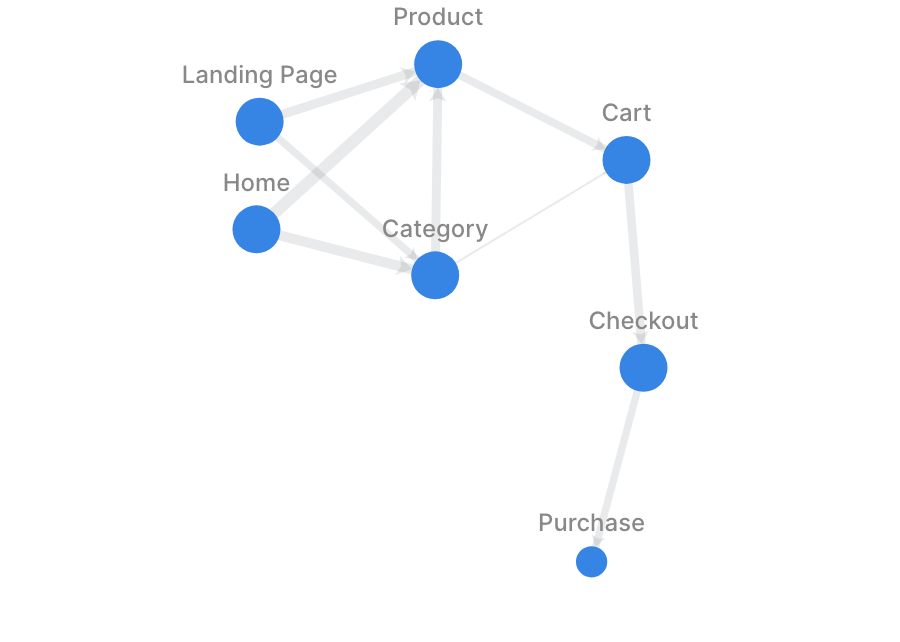
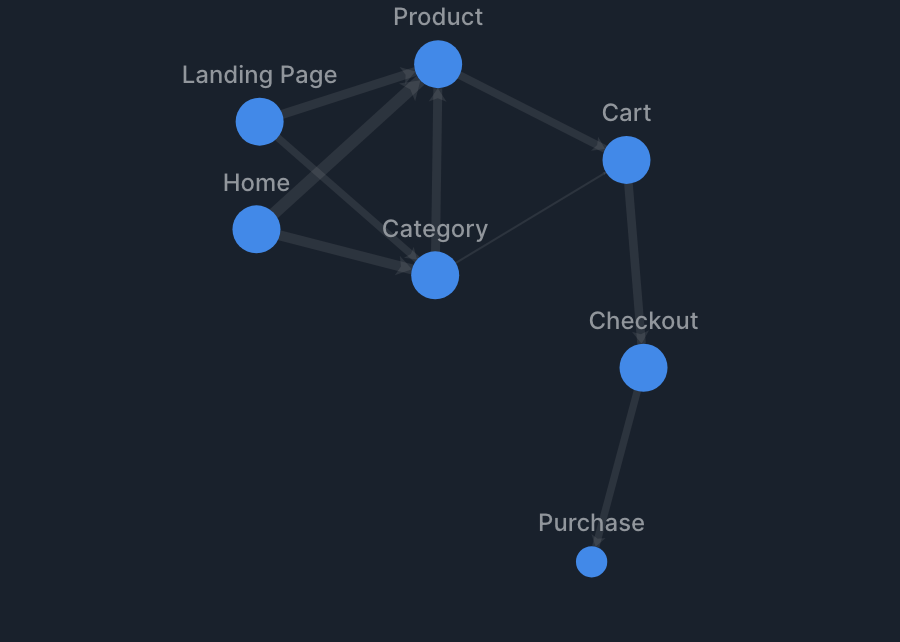
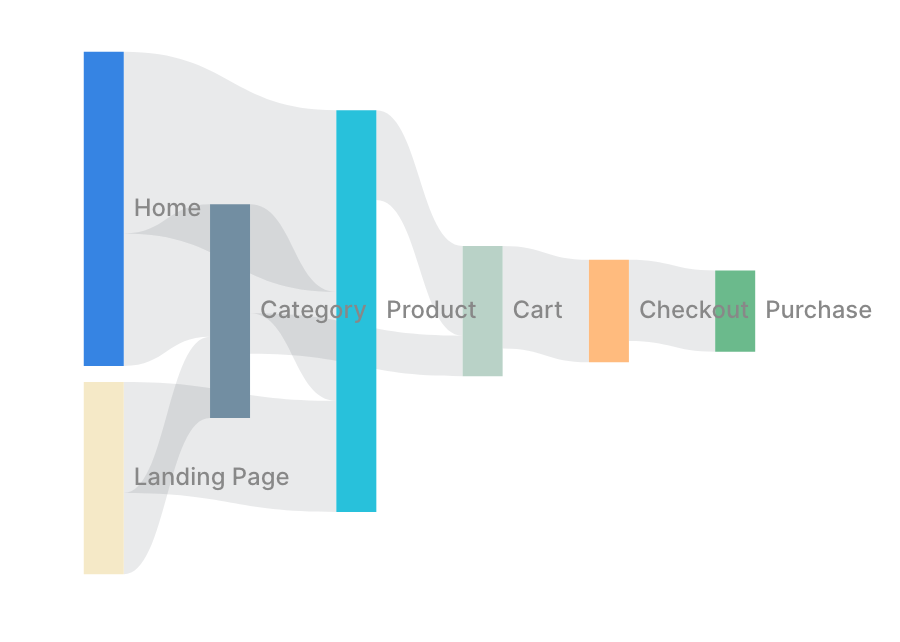
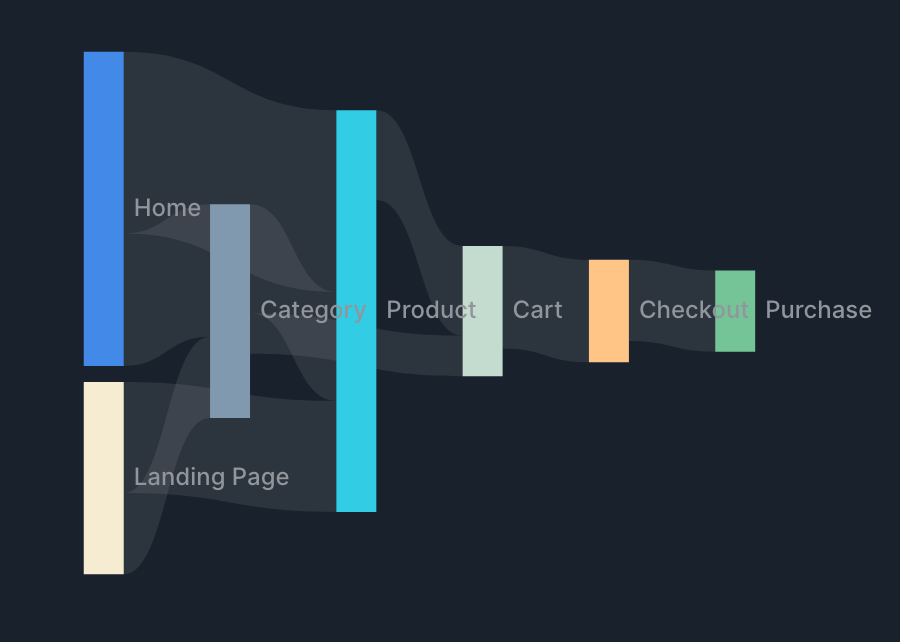
Graph Chart supports the following drawing types.
Specification
Aggregation
Graph Chart aggregates a weight (metric) for each combination of source and target (dimensions) and draws the relationships between nodes.
| Item | Role | Notes |
|---|---|---|
| Source | Dimension | The node the connection originates from. |
| Target | Dimension | The node the connection points to. |
| Weight | Metric | Reflected in edge thickness or node size. |
Examples
- Show "number of page transitions" as a Sankey diagram.
- Source: the page transitioned from.
- Target: the page transitioned to.
- Weight: sum of transition counts.
- Show "mentions between social media users" as a graph.
- Source: the mentioning user.
- Target: the mentioned user.
- Weight: sum of mention counts.
Specification by drawing type
Graph
- Turning on Undirected graph treats the connection between source and target as bidirectional, merging A→B and B→A into one.
- Link node color to weight changes node color based on the node's weight.
Sankey
- The direction of flow is drawn visually.
- If the data contains a circular reference, the chart can't be drawn, and the message "The data contains a circular reference, so it can't be drawn as a Sankey diagram" is shown.
Tips
Frame
Graph Chart supports the frame feature. See Frame for details.