

Appearance
Map Chart
Map Chart displays data on a map. You can specify locations using latitude/longitude, geohash, geocode, or GeoJSON. The available drawing types depend on the data format.
Data formats
Map Chart can display the following data formats on a map.
Latitude/longitude
Draws objects at the specified latitude/longitude position. Specify numeric columns for latitude and longitude. Available with the following drawing types.
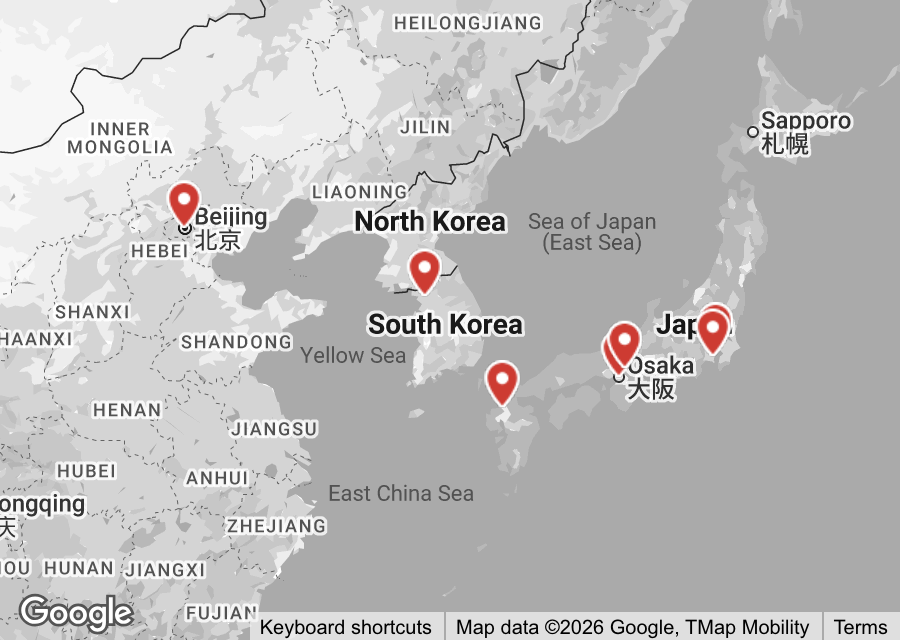
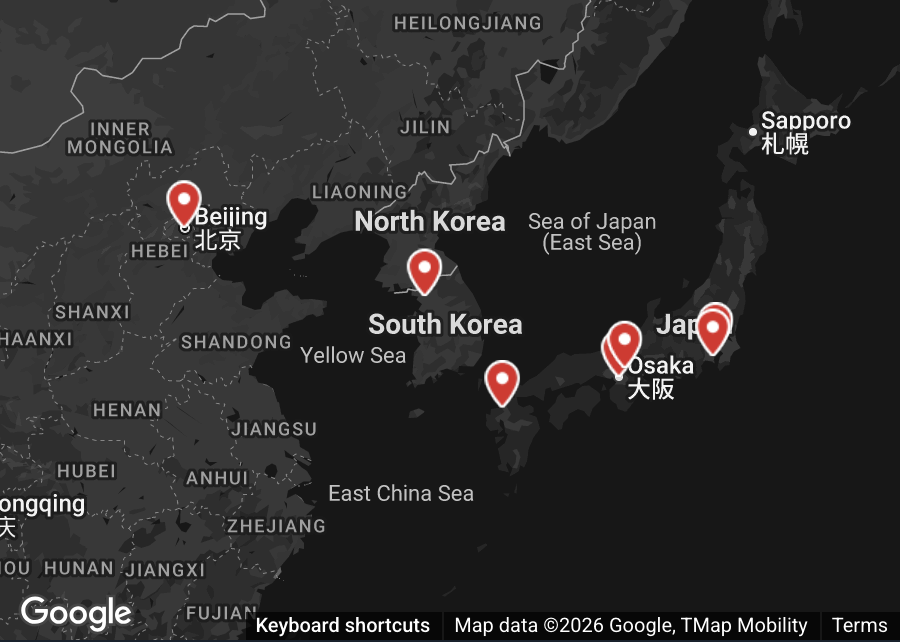
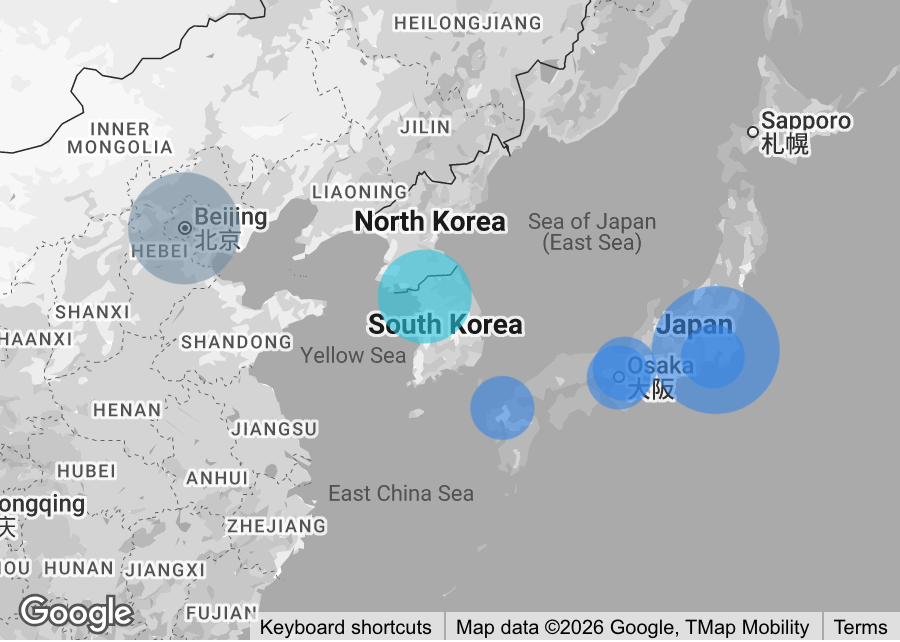
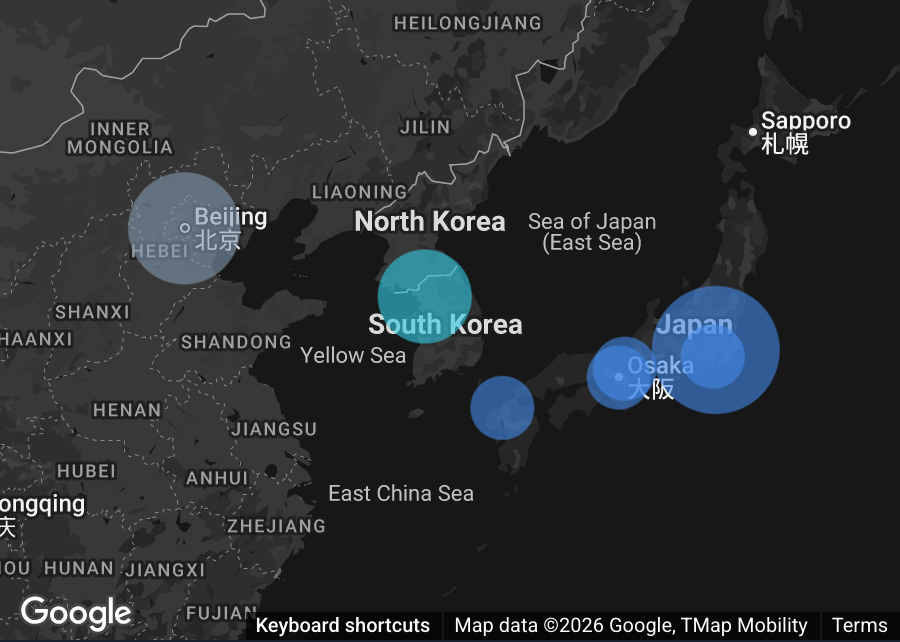
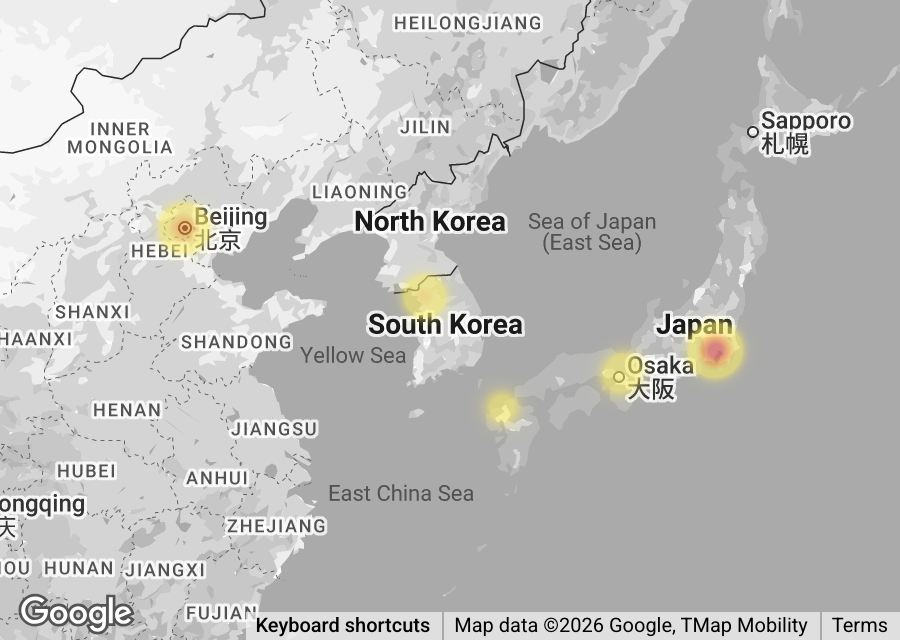
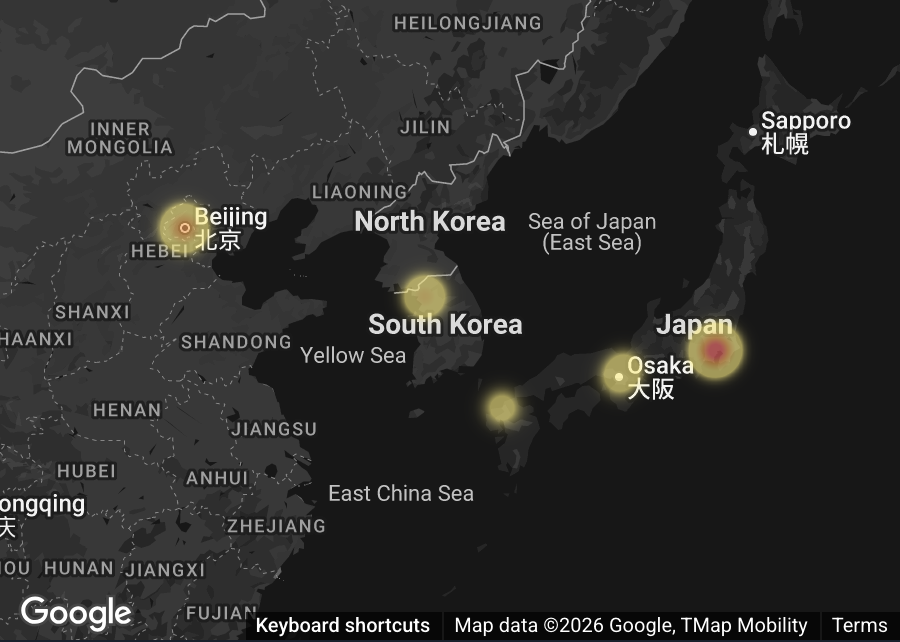
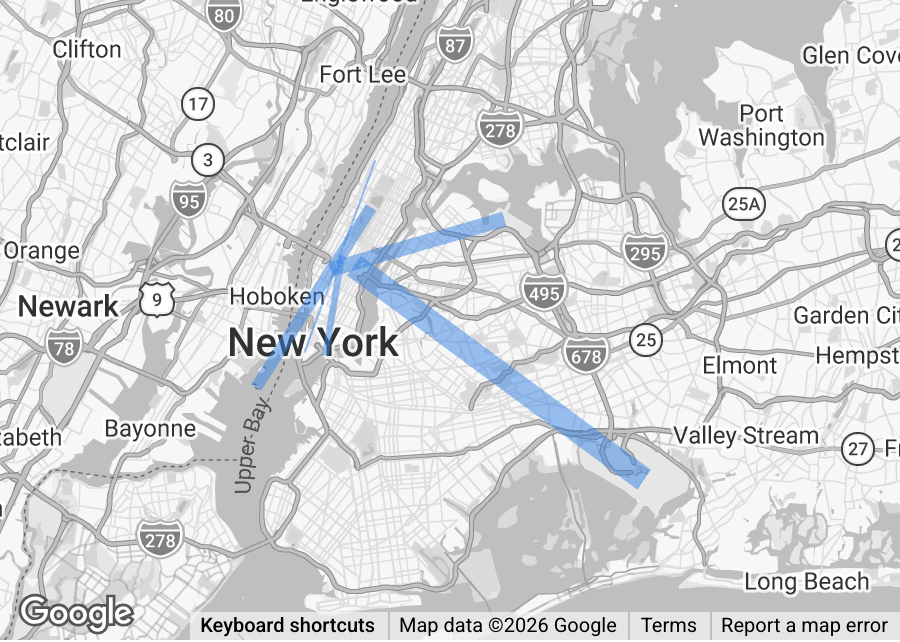
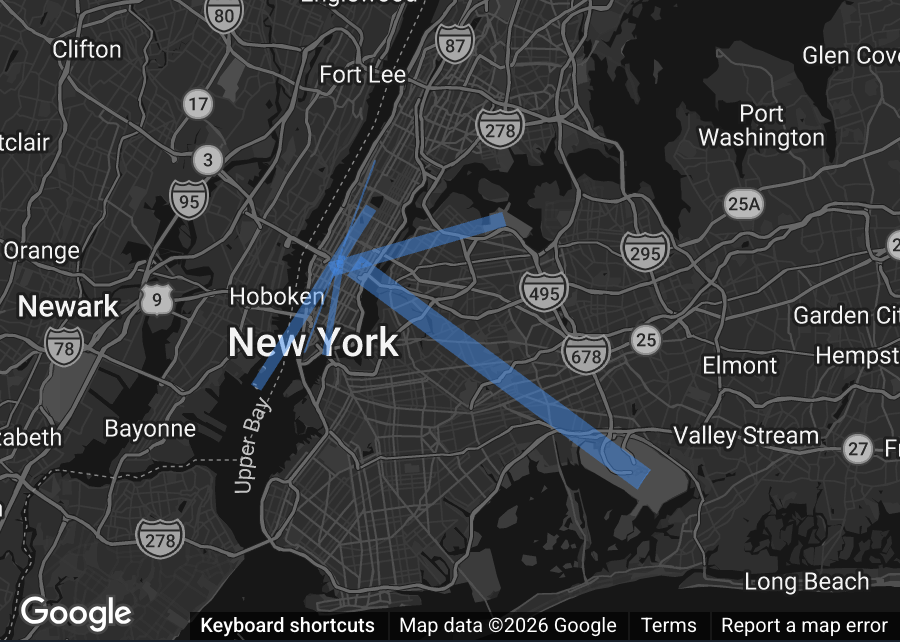
* Flow requires two sets (source and target) of latitude/longitude.
Geohash
Draws objects at the position specified in geohash format.
The following drawing types (same as latitude/longitude) draw an object at the center point of the specified geohash.
- Pin
- Bubble
- Heatmap
- Flow
The following drawing type fills in the area of the specified geohash. (The size of the filled area varies depending on the precision of the geohash.)
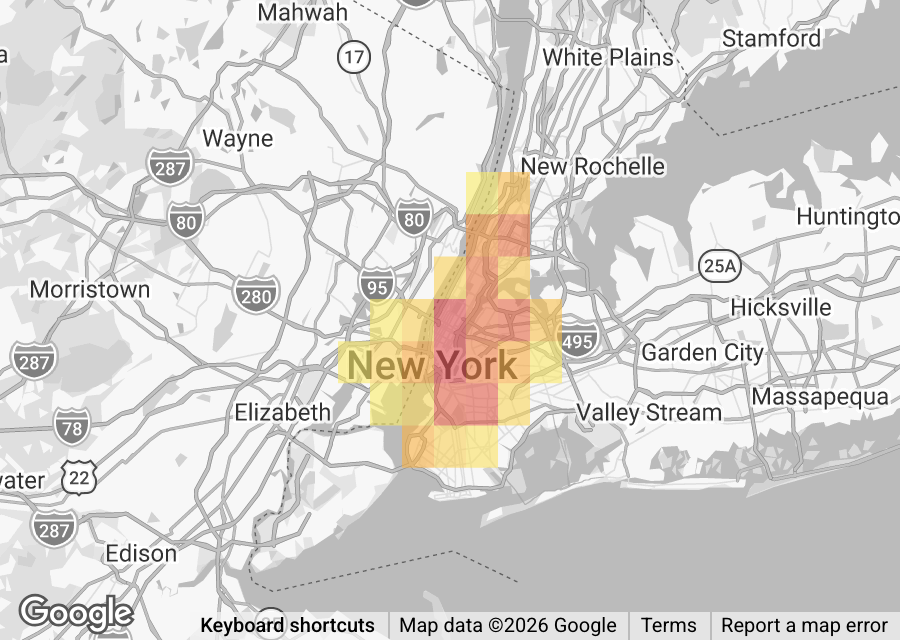
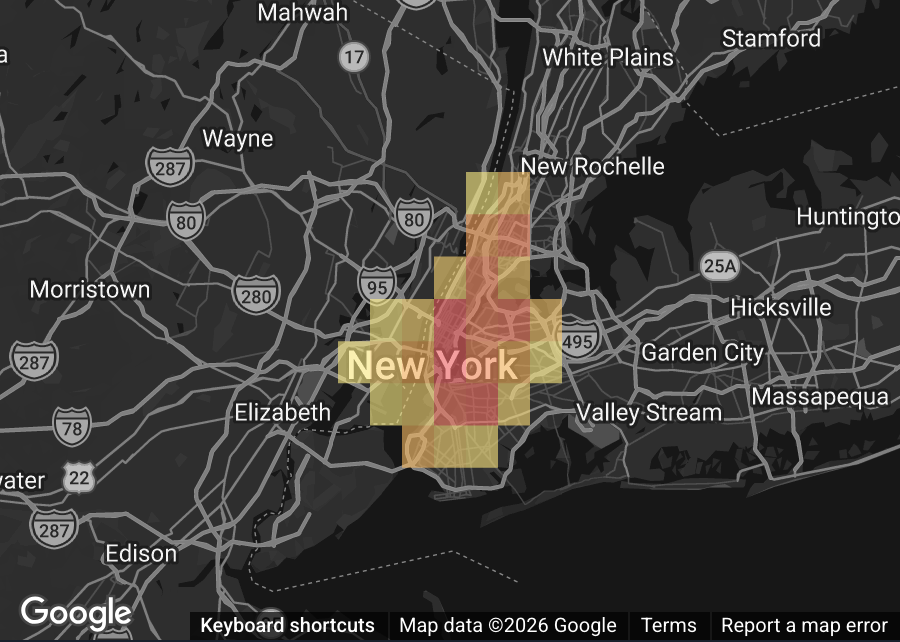
Geohash samples
Here are sample geohashes.
| Geohash | Precision | Example location | Approximate area size |
|---|---|---|---|
| xn | 2 characters | Around Tokyo | 630km × 500km |
| xn7 | 3 characters | Central Tokyo | 78km × 78km |
| xn76 | 4 characters | Tokyo Station area | 20km × 10km |
| xn76u | 5 characters | Around Tokyo Station | 2.4km × 2.4km |
| xn76ur | 6 characters | Near Tokyo Station | 610m × 300m |
| xn76urx | 7 characters | Close to Tokyo Station | 76m × 76m |
| xn76urxk | 8 characters | Around Tokyo Station | 19m × 9m |
BigQuery example
In BigQuery, you can use the ST_GEOHASH function to convert latitude/longitude data to a geohash. Converting to a geohash allows more efficient area-based aggregation and grouping than handling latitude/longitude individually.
The following example uses BigQuery's ST_GEOHASH function to convert latitude/longitude data to a geohash.
sql
SELECT
  ST_GEOHASH(ST_GEOGPOINT(longitude, latitude), 6) AS geohash,
  COUNT(*) AS station_count
FROM
  `bigquery-public-data.new_york_citibike.citibike_stations`
GROUP BY
  geohash
ORDER BY
  station_count DESC
Geocode
Fills in the area associated with a geocode. Available with the following drawing type.
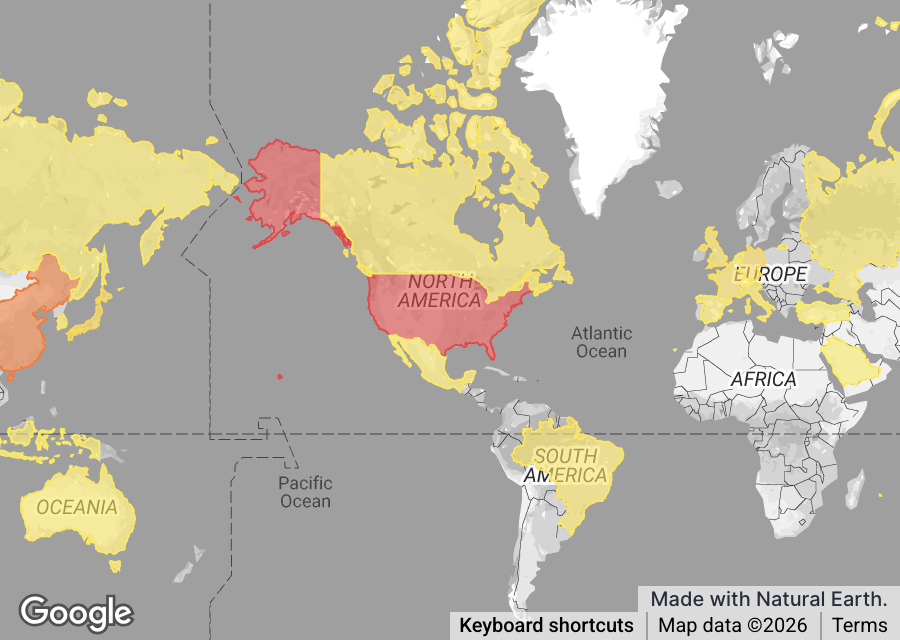
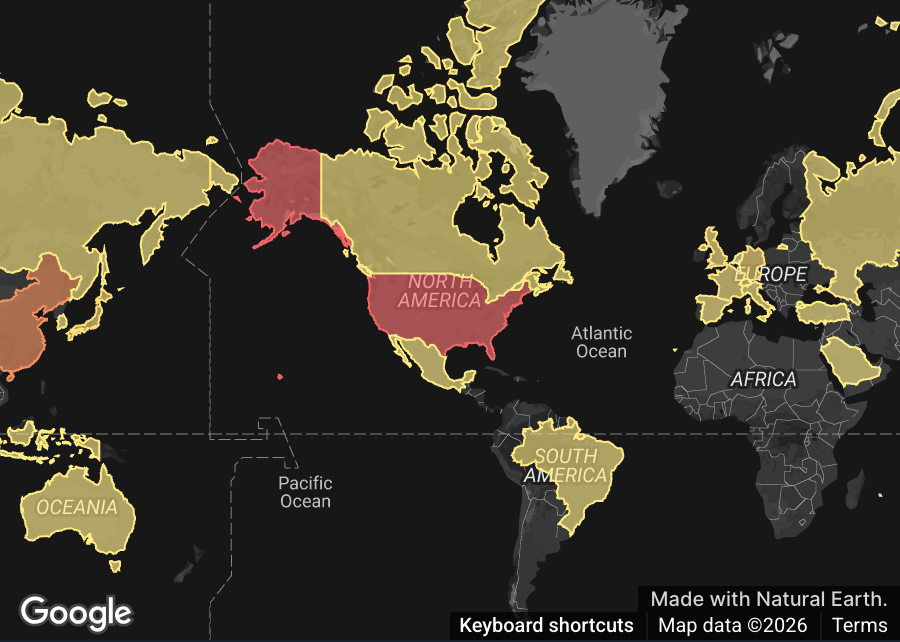
Specify a geocode using a string in one of the following formats.
| Granularity | Geocode format | Geocode example |
|---|---|---|
| Country | 2-letter country code (ISO 3166-1, uppercase) | JP |
| Prefecture (Japan only) | "JP-" + 2-digit prefecture code(JIS X 0402) | JP-13 |
| Municipality (Japan only) | "JP-" + 5-digit municipality code(JIS X 0402) | JP-13101 |
| First 2 digits of postal code (Japan only) | "JP-POST-" + first 2 digits of postal code | JP-POST-10 |
| First 3 digits of postal code (Japan only) | "JP-POST-" + first 3 digits of postal code | JP-POST-100 |
The geospatial data used to fill areas is a lightweight, processed version of the following sources.
- Global country boundary data: Natural Earth
- Boundary data within Japan: "National Land Numerical Information (Administrative Areas)" (Ministry of Land, Infrastructure, Transport and Tourism)
- Postal code boundary data: 郵便番号境界データ(地図地理Sandbox)
A geocode that's valid in format but not included in the above data can't be drawn.
Geocode samples
Here are sample geocodes. See the CSV file of available geocodes for the full list of available geocodes.
| Geocode | Name |
|---|---|
| US | United States |
| JP | Japan |
| JP-01 | Hokkaido |
| JP-02 | Aomori Prefecture |
| JP-03 | Iwate Prefecture |
| JP-01100 | Sapporo City |
| JP-01101 | Sapporo, Chuo Ward |
| JP-01102 | Sapporo, Kita Ward |
| JP-01103 | Sapporo, Higashi Ward |
| JP-01202 | Hakodate City |
| JP-01203 | Otaru City |
| JP-01204 | Asahikawa City |
| JP-POST-10 | Postal codes 10X-XXXX |
| JP-POST-100 | Postal codes 100-XXXX |
GeoJSON
Draws geometry data specified in GeoJSON format on a map. Available with the following drawing types.
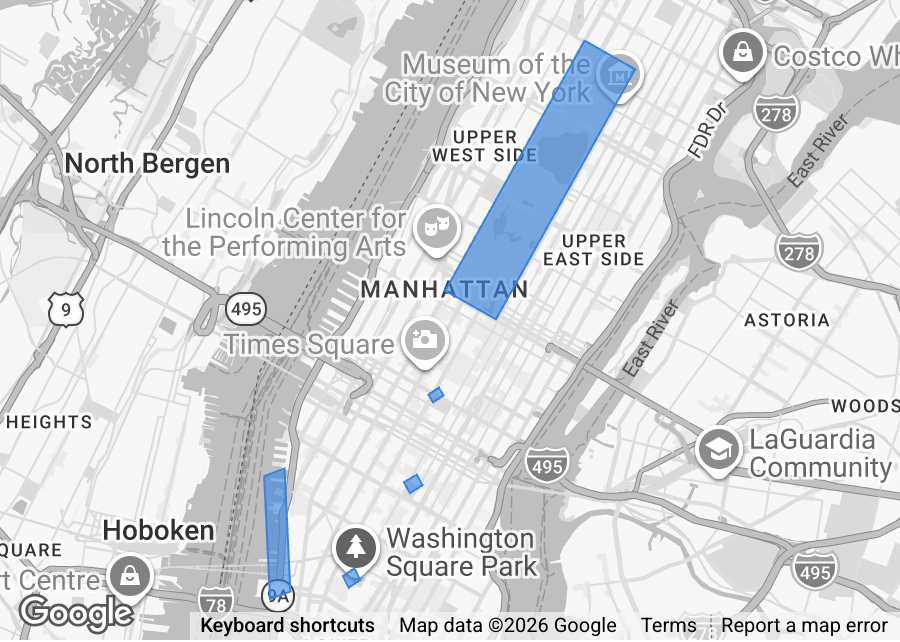
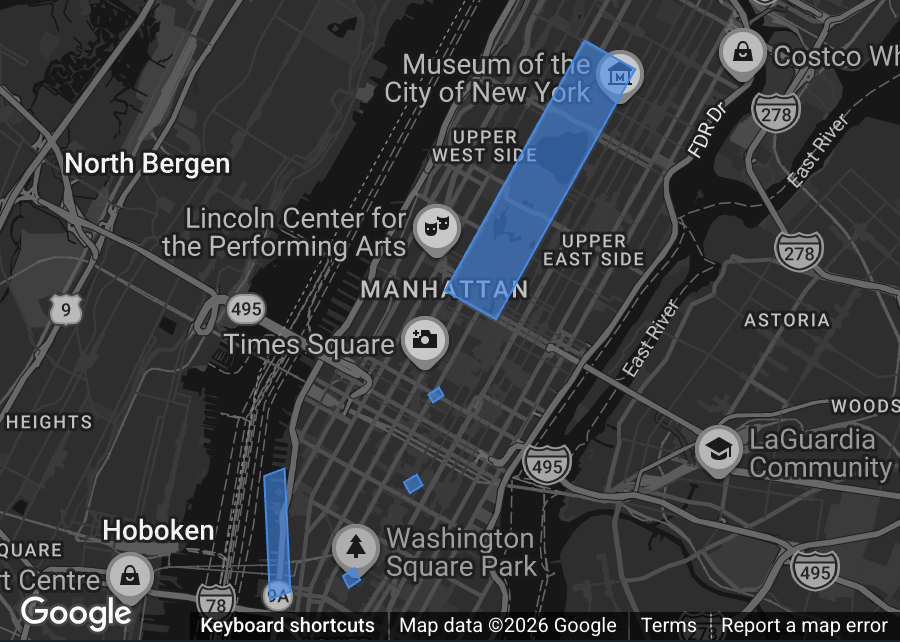
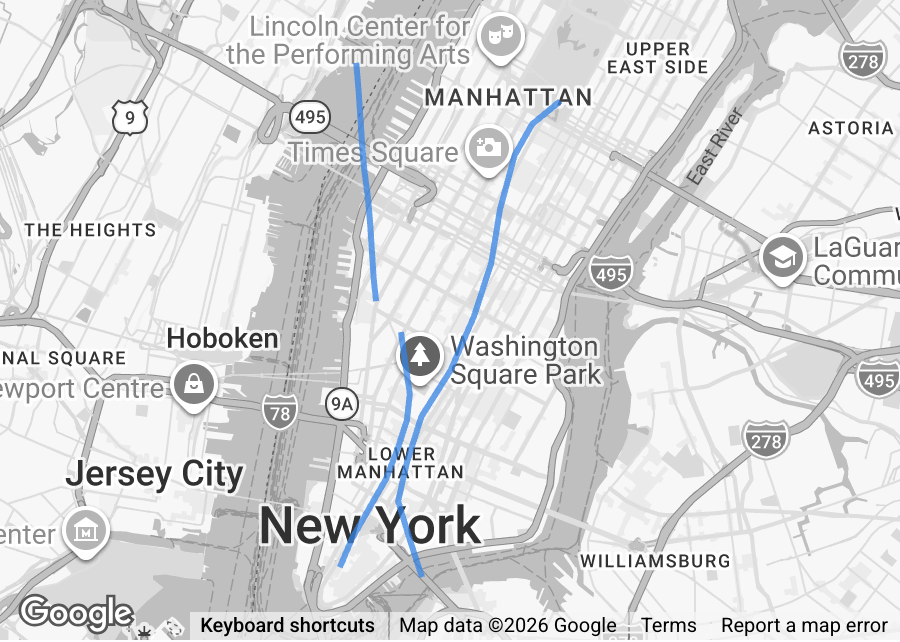
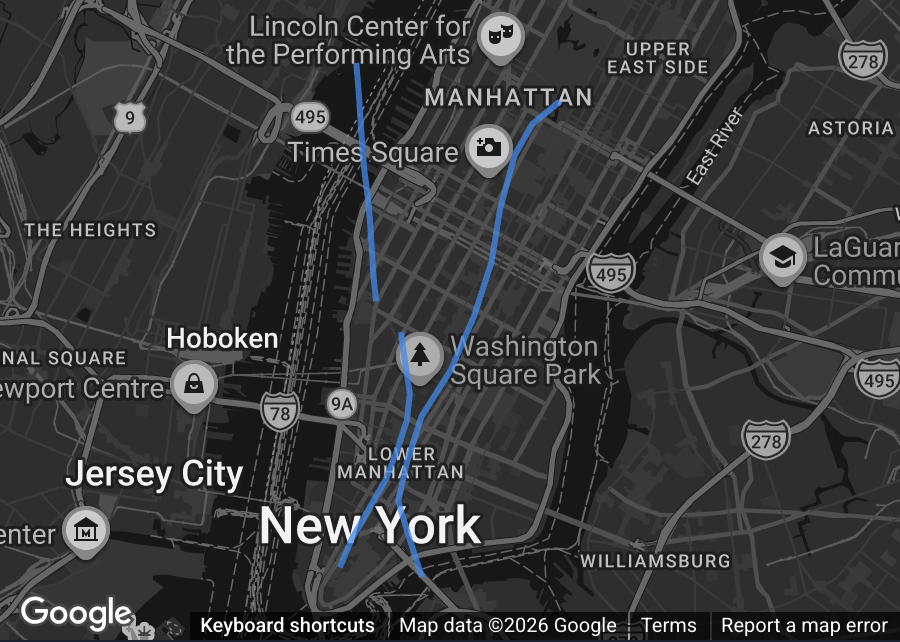
Specify JSON of the following geometry types as a string column.
PointLineStringPolygonMultiPointMultiLineStringMultiPolygonGeometryCollection
GeoJSON sample
json
{
  "type": "Polygon",
  "coordinates": [
    [
      [-73.9812, 40.7681],
      [-73.9581, 40.7681],
      [-73.9581, 40.8007],
      [-73.9812, 40.8007],
      [-73.9812, 40.7681]
    ]
  ]
}
BigQuery example
In BigQuery, you can use the ST_ASGEOJSON function to convert geometry data to GeoJSON format. The following example converts the county_geom column of the bigquery-public-data.geo_us_boundaries.counties table to GeoJSON format.
sql
SELECT
  * EXCEPT (county_geom),
  ST_ASGEOJSON(county_geom) AS county_geom
FROM
  `bigquery-public-data.geo_us_boundaries.counties`
WHERE
  state_fips_code = '36'  -- New York
If the size of the geometry data you want to draw is large, it might hit the size limit for SQL run results and cause an error. In that case, you can use the ST_SIMPLIFY function to simplify the geometry data and reduce its size. Large geometry data also affects rendering performance, so simplify it to the minimum size necessary.
sql
SELECT
  * EXCEPT (county_geom),
  ST_ASGEOJSON(ST_SIMPLIFY(county_geom, 1000)) AS county_geom
FROM
  `bigquery-public-data.geo_us_boundaries.counties`
WHERE
  state_fips_code = '36'  -- New York
Usage limitations
Map Chart uses WebGL to render maps, which brings the following limitations.
- It can't be drawn in browsers that don't support WebGL.
- Because of limits on the number of WebGL contexts, trying to render many map charts at the same time might discard charts that were rendered earlier.
- Redrawing restores the display, but be careful not to have too many map charts on a single page.