

Appearance
Hierarchy Chart
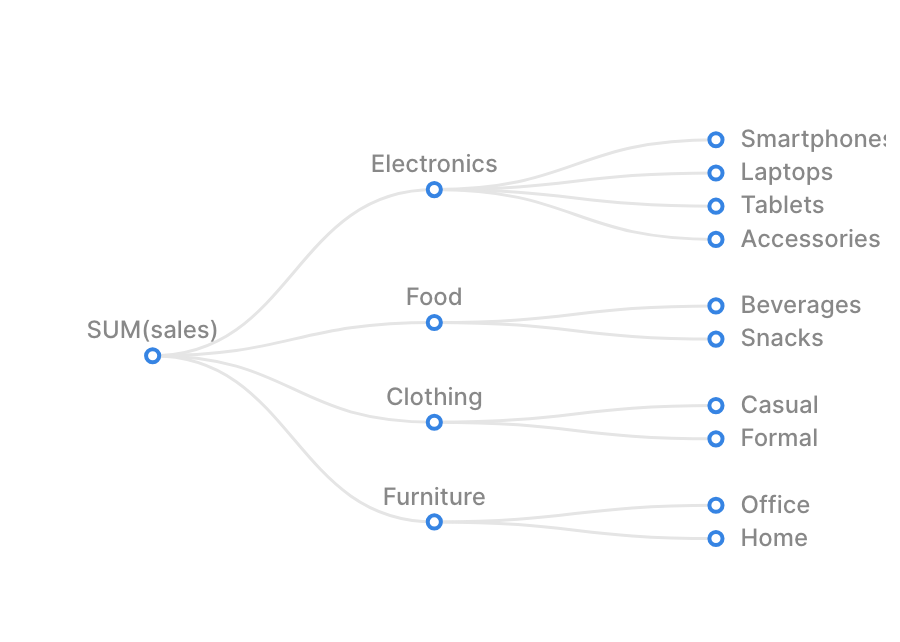
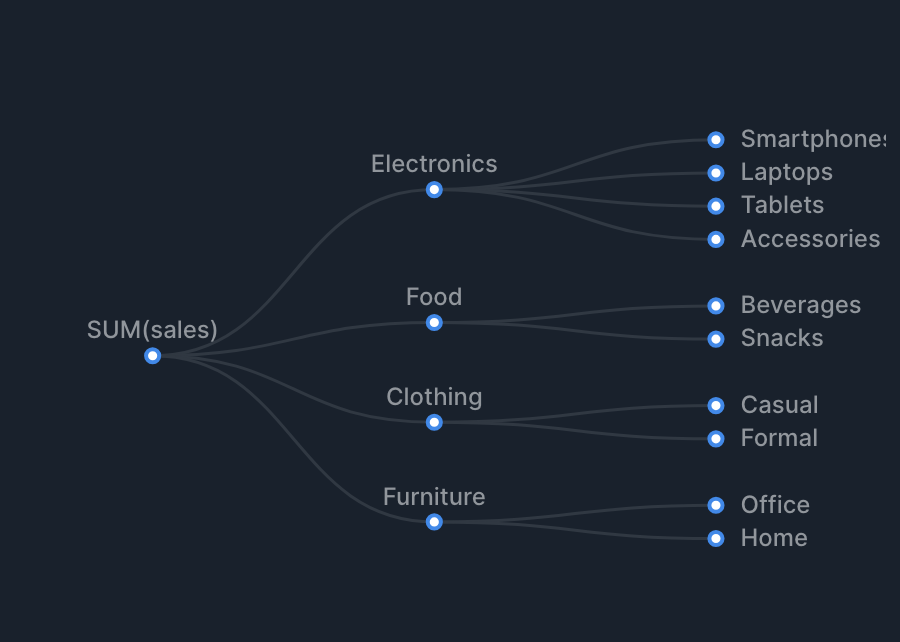
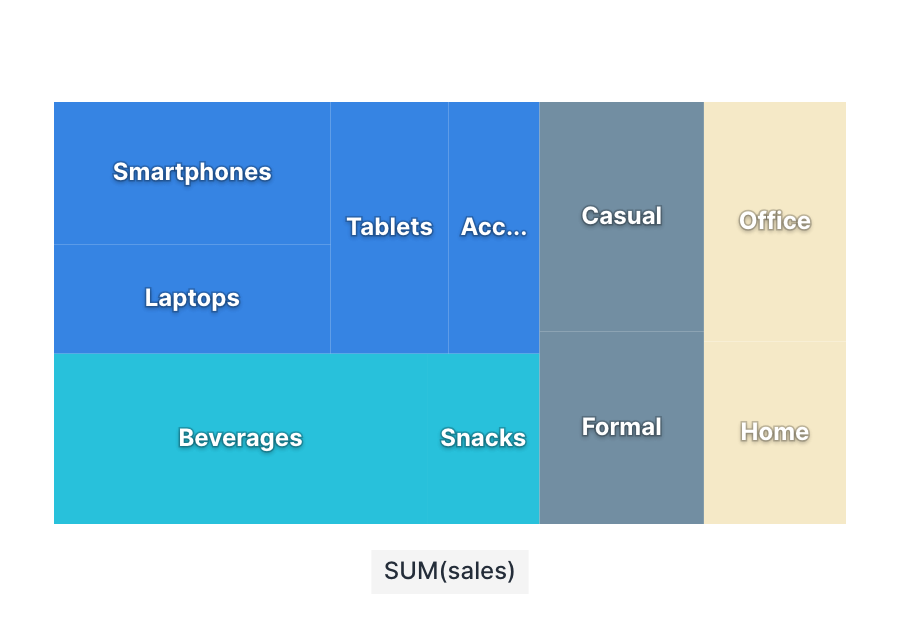
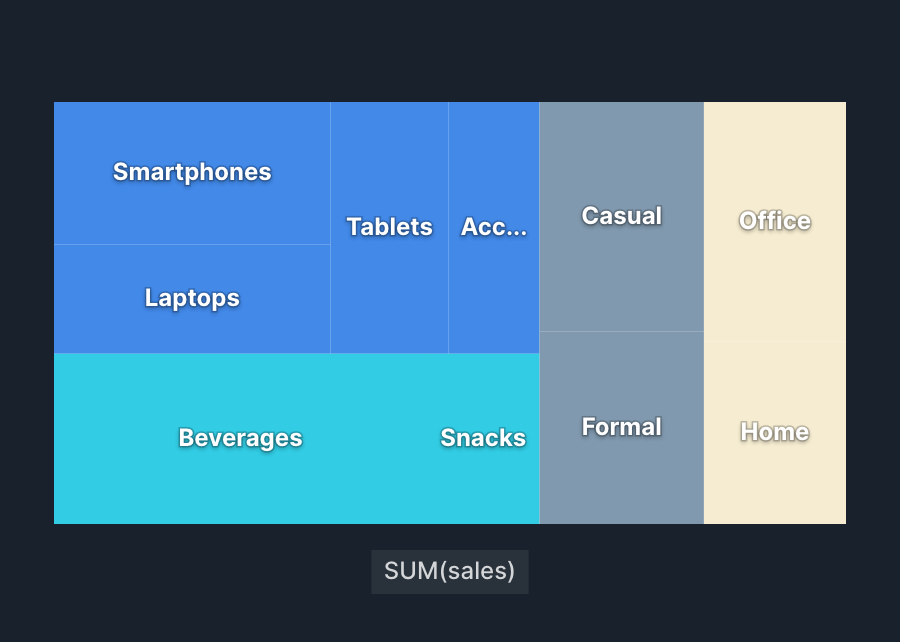
Hierarchy Chart visualizes data that has a hierarchical structure. You specify a hierarchy (one or more dimensions) from the broadest level down, and aggregate an optional value (metric) as the weight.
Drawing types
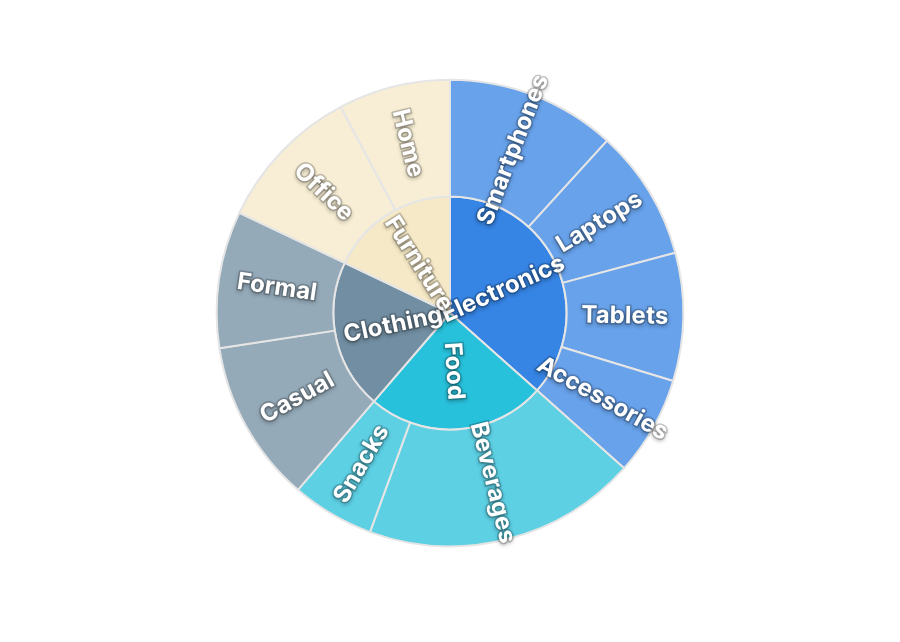
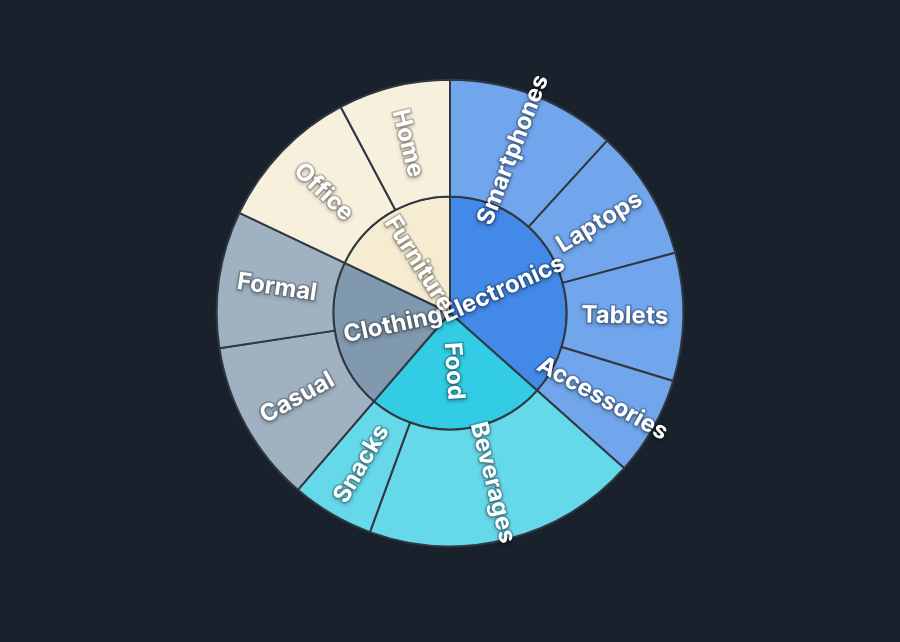
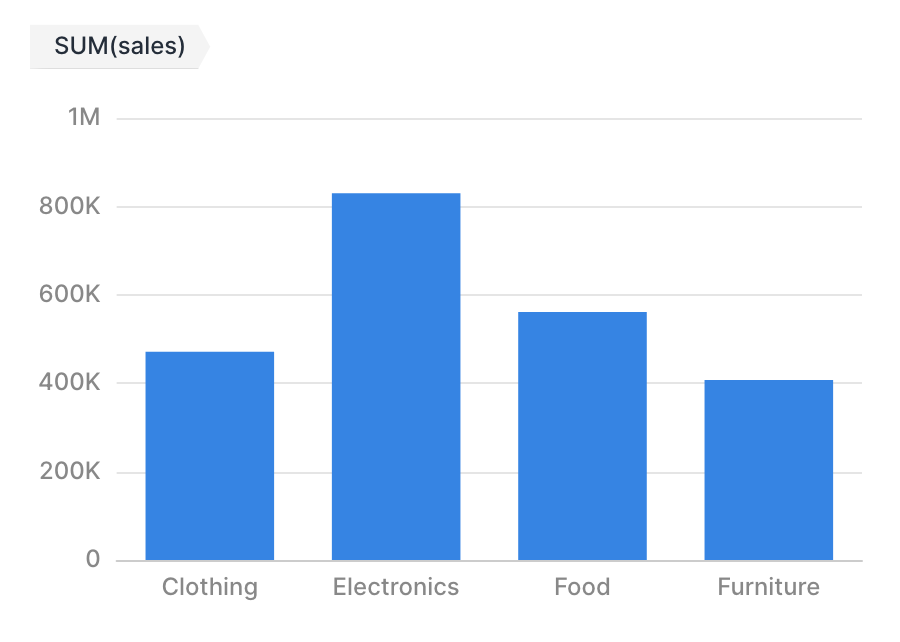
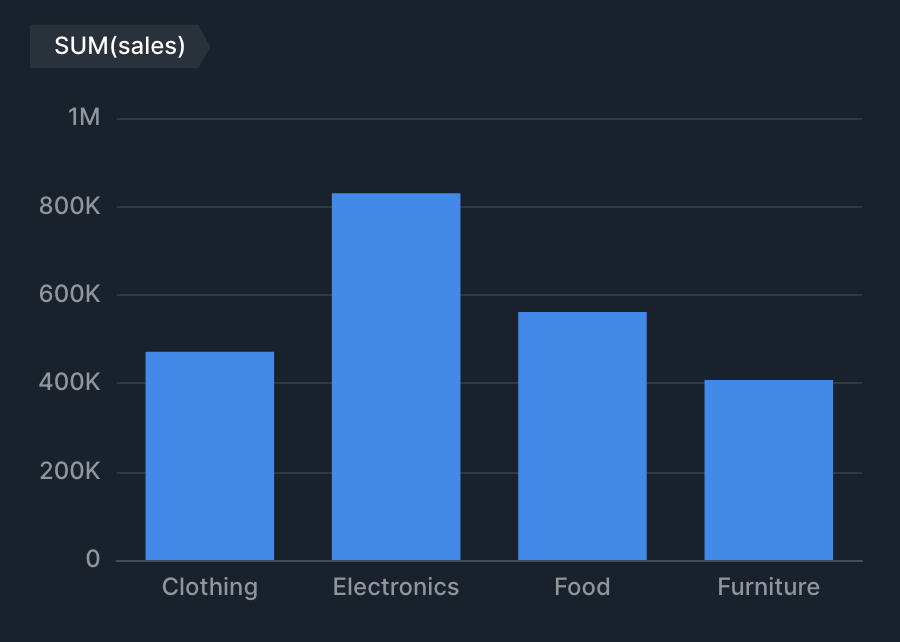
Hierarchy Chart supports the following drawing types.
Specification
Aggregation
Hierarchy Chart aggregates a value (metric) for each level of the hierarchy (dimension) and draws the hierarchical structure.
| Item | Role | Notes |
|---|---|---|
| Hierarchy | Dimension | Specified from the top level down (for example: country → state → city). |
| Value | Metric | If specified, the sum of this becomes the drawing weight. If not specified, aggregation is done by count. |
Examples
- Show "sales breakdown by region → state → city" as a sunburst chart.
- Hierarchy: region, state, city.
- Value: sum of sales.
- Show "count by organizational hierarchy" as a tree.
- Hierarchy: division, section, team.
- Value: none (aggregated by row count).
Specification by drawing type
- Tree, treemap, and sunburst draw the hierarchical structure as-is.
- Bar chart (drill down) starts from the top level, and selecting an item navigates to the next level.
- Specify 2 or more levels, and set the drawing type to "Bar chart (drill down)".
Tips
Frame
Hierarchy Chart (tree, treemap, sunburst) supports the frame feature. Bar chart (drill down) doesn't. See Frame for details.