

Appearance
Waterfall Chart
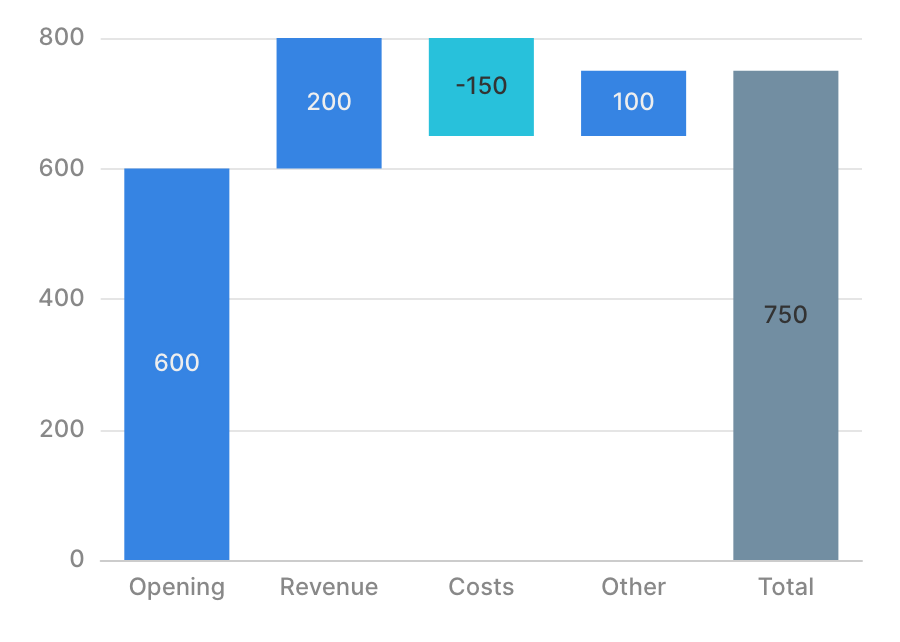
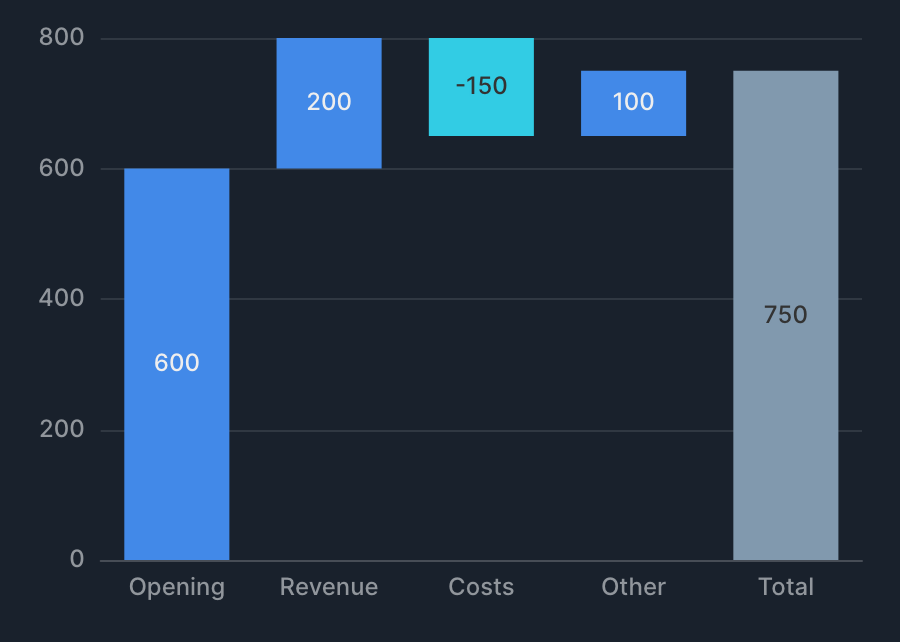
Waterfall Chart shows the cumulative increase and decrease of items. The order of labels (dimension) determines the stacking order, and the sign of the value (metric) represents an increase or decrease.
Specification
Aggregation
Waterfall Chart aggregates a value (metric) for each label (dimension) and displays the result cumulatively.
| Item | Role | Notes |
|---|---|---|
| Label | Dimension | The name of each waterfall item. Its order becomes the stacking order. |
| Value | Metric | Displayed as the increase/decrease value of each item. |
You can control the order of labels with sort. Since order directly affects the meaning of the visualization, make sure to configure it to reflect the intended order.
Example
- Show the change from "opening balance → revenue → expenses → other" as a waterfall (for example, a breakdown of profit/loss or cash flow).
- Label: names such as opening, revenue, expenses, other, and closing.
- Value: the amount (increase/decrease) of each item.
Tips
Frame
Waterfall Chart supports the frame feature. See Frame for details.