

Appearance
Pivot Table
Pivot Table cross-tabulates a value (metric) against rows and columns (dimensions) and displays the result as a two-dimensional table.
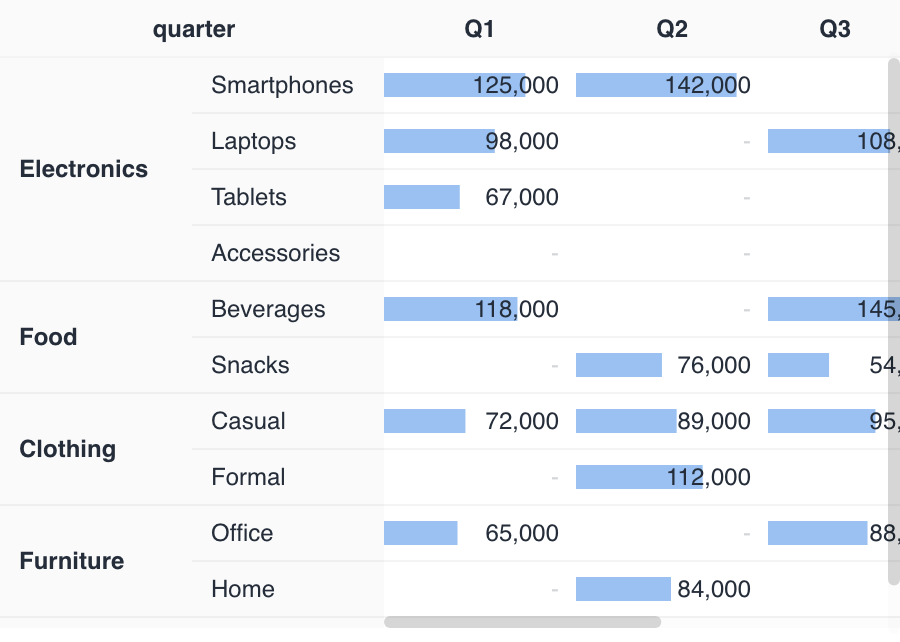
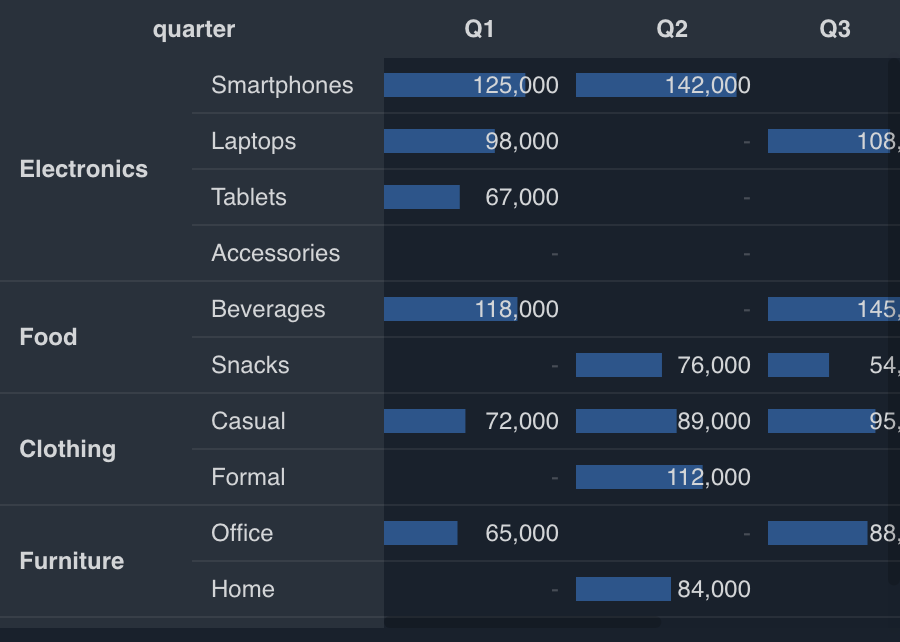
Specification
Field roles
Pivot Table treats rows and columns as dimensions and the value as a metric, and shows the aggregated result as a table.
| Item | Role | Notes |
|---|---|---|
| Rows | Dimension | One or more. |
| Columns | Dimension | Optional. |
| Value | Metric | Supports numeric and string metrics. |
You can control the order with row sort / column sort. See Filter, sort, and limit for details.
Column header operations
From a column header of the rendered table, you can change column widths and pin columns. Only row-axis columns can be pinned; Pin all aggregate columns to left pins them together at the left edge. For columns generated as values, subtotals, or totals, only Column width operations are available.
Tips
Drill down
Pivot Table can display rows hierarchically and let you collapse them.
When you set two or more row fields, you can expand and collapse each row group. When you set two or more column fields, the column axis also displays collapsible groups. Both hierarchies are initially expanded.
Use the hierarchy as follows.
- Set multiple row or column fields.
- In the chart settings, set 2 or more fields for Rows or Columns, such as a major category and a minor category.
- Example: state (major category) → city (minor category).
- Use the toggle icons in the table to expand or collapse the hierarchy.
- To change the row-axis display, select an option under advanced settings > Layout > Default hierarchy type.
- Grid: displays a table format. Collapsing a group folds it into a single row with aggregate values.
- Tree: displays the hierarchy in a single column and shows aggregate values in each upper-level row.
- Select Start collapsed to collapse all hierarchy levels on initial display.
Additional notes:
- You can set the row-axis hierarchy type only when there are 2 or more row fields.
- Report viewers can freely expand and collapse the hierarchy.
- When all Value aggregation methods cannot be re-aggregated for subtotals and totals, total rows and columns are not displayed, and the aggregate cells of collapsed groups are left empty.
Differences by processing method
Pivot Table shows different results depending on whether in-memory processing was used or SQL-based processing was used.
- With in-memory processing
- There's no limit on the number of rows or columns, and all aggregated data can be displayed.
- With SQL-based processing
- When both rows and columns are specified, each axis has a unique item limit. Excess items are grouped into
(Others)at the end of the axis. - The default is 30 for each axis. You can change Max row items / Max column items in the chart's Basic settings, or in Explorer Pivot conditions.
(Max row items + 1) × (Max column items + 1)must be 1,000 or less. A combination that exceeds this limit is an error.- If you set only one of Max row items / Max column items, the unspecified side is treated as the maximum that fits when checking this product.
- If the specified value is large, that product can still exceed the limit. For example, 700 on one axis with the other unset is an error.
- When only rows or columns are specified, the specified axis displays up to 990 items.
- When both rows and columns are specified, each axis has a unique item limit. Excess items are grouped into
See Limits for the chart rendering limit.